Title: A Beginners Guide to Technical Analysis
If you’re new to trading, you may have heard about technical analysis and wondered what it’s all about. Technical analysis is a powerful tool used by traders to evaluate price movements and make informed trading decisions based on historical data. In this guide, we’ll cover the essentials of technical analysis and provide you with a solid foundation to start using it in your own trading journey.
What is Technical Analysis?
Technical analysis is the study of past market data, primarily price and volume, to forecast future price movements. Unlike fundamental analysis, which evaluates a company’s intrinsic value, technical analysis focuses on patterns, trends, and trading signals that can indicate potential market direction.
The core idea behind technical analysis is that market prices reflect all known information, and price movements often follow identifiable patterns.
Key Principles of Technical Analysis
Before diving into the specifics, it’s helpful to understand some fundamental principles of technical analysis:
- Market Discounts Everything: All available information is already reflected in the price, meaning that price action is all you need to analyze.
- Price Moves in Trends: Prices typically follow a trend—up, down, or sideways—until a definitive reversal occurs.
- History Tends to Repeat Itself: Market behavior tends to follow historical patterns, making it possible to anticipate future moves based on past performance.
Important Tools and Concepts in Technical Analysis
To start using technical analysis, here are the essential tools and concepts you need to know:
1. Charts
Charts are the foundation of technical analysis and provide a visual representation of price movements over time. The most common types are:
- Line Chart: Plots closing prices over a set time period, forming a simple line.
- Bar Chart: Shows opening, closing, high, and low prices for each period, providing more detailed information.
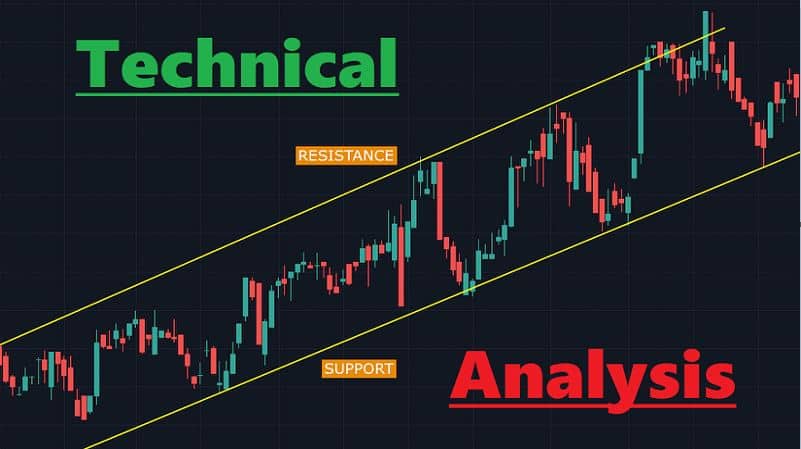
- Candlestick Chart: Popular among traders, candlesticks show open, high, low, and close prices with visually distinctive “candles” for each period.
Candlestick charts are particularly useful for identifying market sentiment and are commonly used in technical analysis.
2. Support and Resistance Levels
Support and resistance levels are key concepts in technical analysis:
- Support Level: The price level at which an asset tends to stop falling and may start rising due to increased buying interest.
- Resistance Level: The price level where an asset tends to stop rising and may begin to fall due to selling pressure.
These levels help traders identify potential entry and exit points by anticipating where price reversals or continuations might occur.
3. Trends and Trendlines
Identifying trends is crucial in technical analysis, as prices typically move in trends rather than randomly. There are three types of trends:
- Uptrend: A series of higher highs and higher lows.
- Downtrend: A series of lower highs and lower lows.
- Sideways/Range-bound: Prices move within a horizontal range.
Trendlines are lines drawn along highs or lows to visually indicate the direction of a trend, helping traders identify potential breakout or breakdown points.
4. Technical Indicators
Technical indicators are mathematical calculations based on price, volume, or open interest data. Here are a few essential indicators for beginners:
- Moving Average (MA): Averages out price data over a specified period, smoothing out price action and identifying trends.
- Relative Strength Index (RSI): Measures the speed and change of price movements, helping to indicate overbought or oversold conditions.
- MACD (Moving Average Convergence Divergence): A trend-following momentum indicator that signals potential reversals or continuations based on the convergence or divergence of two moving averages.
Start with one or two indicators and gradually explore more as you gain experience.
5. Chart Patterns
Chart patterns are formations created by price movements that indicate potential future behavior. Common patterns include:
- Head and Shoulders: A reversal pattern signaling a potential trend reversal.
- Double Top/Double Bottom: Indicates a likely change in the direction of a trend.
- Triangles (Ascending, Descending, and Symmetrical): Typically represent continuation patterns where prices may break out in the direction of the previous trend.
How to Start Using Technical Analysis
Here are some steps to get started with technical analysis:
- Choose a Charting Platform: Popular charting tools include TradingView, MetaTrader, and your broker’s trading platform. Familiarize yourself with the interface and tools.
- Identify Your Preferred Time Frame: Time frames vary from 1-minute charts for day traders to weekly or monthly charts for long-term investors. Choose a time frame that suits your trading style.
- Practice Identifying Trends, Support, and Resistance: Practice drawing trendlines and identifying support and resistance levels. These are essential for interpreting price action.
- Experiment with Indicators and Patterns: Start with one or two indicators and chart patterns. For instance, try using the RSI and Moving Average to assess potential buying or selling points.
- Backtest and Refine Your Strategy: Before applying technical analysis with real money, test your strategy on historical data to see how well it performs. Most charting platforms allow you to replay past price action for practice.
Common Mistakes to Avoid in Technical Analysis
- Overusing Indicators: Relying on too many indicators can lead to “analysis paralysis.” Stick to a few key indicators that suit your strategy.
- Ignoring the Bigger Picture: Avoid focusing solely on technical analysis and ignoring broader market trends and fundamentals.
- Lack of Risk Management: Even with technical analysis, trading involves risk. Always use stop-loss orders and position sizing to protect your capital.
Conclusion
Technical analysis is a valuable skill that can empower you to make data-driven trading decisions. While it takes practice and patience to master, understanding the basics like chart patterns, indicators, and trends is a great starting point. Remember, no strategy guarantees success, so always practice good risk management and continually refine your approach.
Happy trading, and may your analysis lead to informed, profitable decisions!


